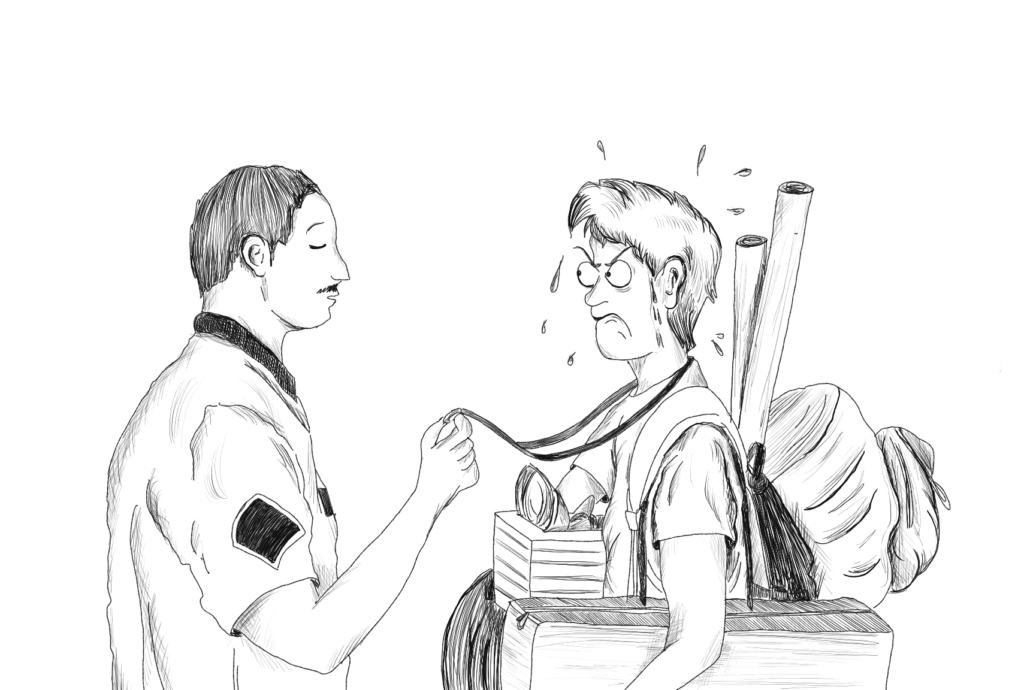
Srishti '23, Unwrapped
A visual exploration and analysis of 20,000+ messages in the Srishti '23 Whatsapp group
I decided to analyze the chats from the Srishti '23 Whatsapp group between July 22, 2019, and December 07, 2020. What does almost one and a half years worth of conversation, spanning over 16, 400 messages, have to tell us? Hover your mouse over each graph for the numbers. Additional brownie points if you recognize the category headings ; )
This is an anonymized dataset. The first step I take is to make sure everyone's names are hashed (Aman becomes 303A92Z)
I could know if I really, really, really, really wanted to. But I don't.
Hark, ye scroller!
This project and it's graphs are best viewed on a larger screen. Unless you like squished graphs, then this might just be the thing for you.
Sign of the Times
I broke up the messages into blocks of cycles and studio, starting from Cycle 1 (July 22 to Sept 06, 2019) of FSP to Studio 2 (Oct 20 to Nov 14, 2020). Some of these dates are very close approximations, but they help in giving a broad idea of our activity in key timelines.
Keep Talking
In a group of 257 people, it took only 5 to send a total of over 2700 messages in this period. Take it easy, guys. We also had our share of 11 lurkers, who've talked just once.I've attached a full graph for total messages by all members too, see if you can find out who you are (names are hidden, of course).
See Entire Distribution
16.4% of the texts were sent by 5 people
See Entire Distribution
Time After Time
What times are we most active? Aside from the few incredible people who like speaking at 4 am, our activity shows the usual spikes around 1 pm - 12 pm (lunch breaks) and when classes get over, between 3 pm - 4 pm. We're most active in the evenings though, between 6-7 pm. Not surprising. 0 messages sent between the ungodly hours of 1 AM and 6 AM.
Why?
Eight Days a Week
The days were we most active, split by the unit we were in at the time.Least amount of activity on Wednesdays regardless of which unit we were in. Coupled with the information above, you have the best chance of getting responses for your surveys if you share the link on Sundays between 6-7 pm. But please don't.
I got a feeling
What has our mood been like over the past year and a half? For this, I calculated the sentiment of each word during a particular day and the net sentiment of that day was calculated as:
Net Sentiment = Positive Sentiment - Negative Sentiment
We feel angry a lot, but what did we feel the angriest about? Online classes and BJP goons bursting into the college definitely left a mark.While we weren't exactly happy, the highest positive sentiment was encountered when we talked about whether or not to give college time and see how they handled the online classes, after an iffy revisit.
Did you see the words
What did we say over and over and over and over and over and over? We find this using a trigram analysis. A trigram here would be each text broken into three consecutive words, which are then counted.
Varij probably wanted to know.
See All Trigrams
| Phrase | Number of Times used |
|---|---|
| Does anyone have... | 159 times |
| Do we have... | 73 times |
| At the airport... | 62 times |
| Does anyone know... | 47 times |
| Let me know... | 41 times |
| Varij wants to know... | 15 times |
See All Trigrams
Lonely at the Top
The people we mentioned the most.
Pavit, send link.
Who Let the Dogs Out
How many surveys did we answer? What are the ways people asked you to fill their surveys? Oh, and how many other Whatsapp groups got created (and probably died)?
40
New Whatsapp
Groups Created
155
Surveys
Posted, Jeez
What about us?
Sometimes it feels like the only thing we do is ask questions. This class, those credits, this email, that attendance.
How many questions did we ask, and of what kind? The highest were implied questions. These are questions like "Sure?", "Kal Kya Scene Hai?", "Ravi's class?", which don't use questioning words directly.
A little more interesting was the second highest question type, "Anyone?". A significant portion of the questions are looking to connect with people outside your immediate group.
2170
Questions asked
The racket they made
What were we talking about when the largest number of people had something to say?
96 people joined the conversation on the day we had the Zoom call with our new deans, the highest number of unique texters on a single day.
Random Numbers
740
Images Sent
340
Messages Deleted. Whoops.
155
Times We Said +1
in Agreement
Hahahahahahahahah
The longest haha was 17 characters long.
125
lols
230
we said f*ck

Illustration by Sahana Sundar


